

Should You Sell Stocks When Bonds Pay Higher Interest Rates?
Key Takeaways:
- Stocks didn’t do worse when rates were high. Bonds did better. In the 34 years that started with a 10-year yield above 5%, stocks averaged 11.2% a year, close to the 12.2% they averaged in the other years. Bond returns jumped from 2.6% to 8.9%.
- So stocks’ edge over bonds shrank. When yields started above 5%, stocks beat 10-year bonds by an average of 2.3 percentage points a year, compared with 9.6 points in the other years. Stocks still came out ahead in 19 of those 34 years.
- Higher yields weren’t simply worse. In the 12 years that started with yields above 8%, stocks’ edge over cash was slightly above average. The weak years clustered in the 5% to 8% range.
- A handful of years drive the gap. Remove five bear-market years (1973–74 and 2000–02), and stocks’ edge over bonds in high-yield years returns to 7.0 points, exactly its long-run average.
“Why would I own stocks when bonds pay 5%?”
After decades of low interest rates, it’s a fair question. In case you’ve avoided the news this week – the 10-year Treasury closed at 5.11% on September 23, its highest level since 2007.
With concerns of an AI bubble, and after 3 years of stellar stock market growth, that 5% level has a lot of people asking if they should be taking chips off the table, and making sure they lock in that 5%.
Is that a wise thing to do?
I first got the idea to look into the data because of a Dimensional Fund Advisors (DFA) article they recently published. Their answer was basically relax. Going back to 1927, the extra return stocks earned over Treasury bills averaged 9.9% in years when bill rates started low and 8.1% when they started high, close enough to call it noise.
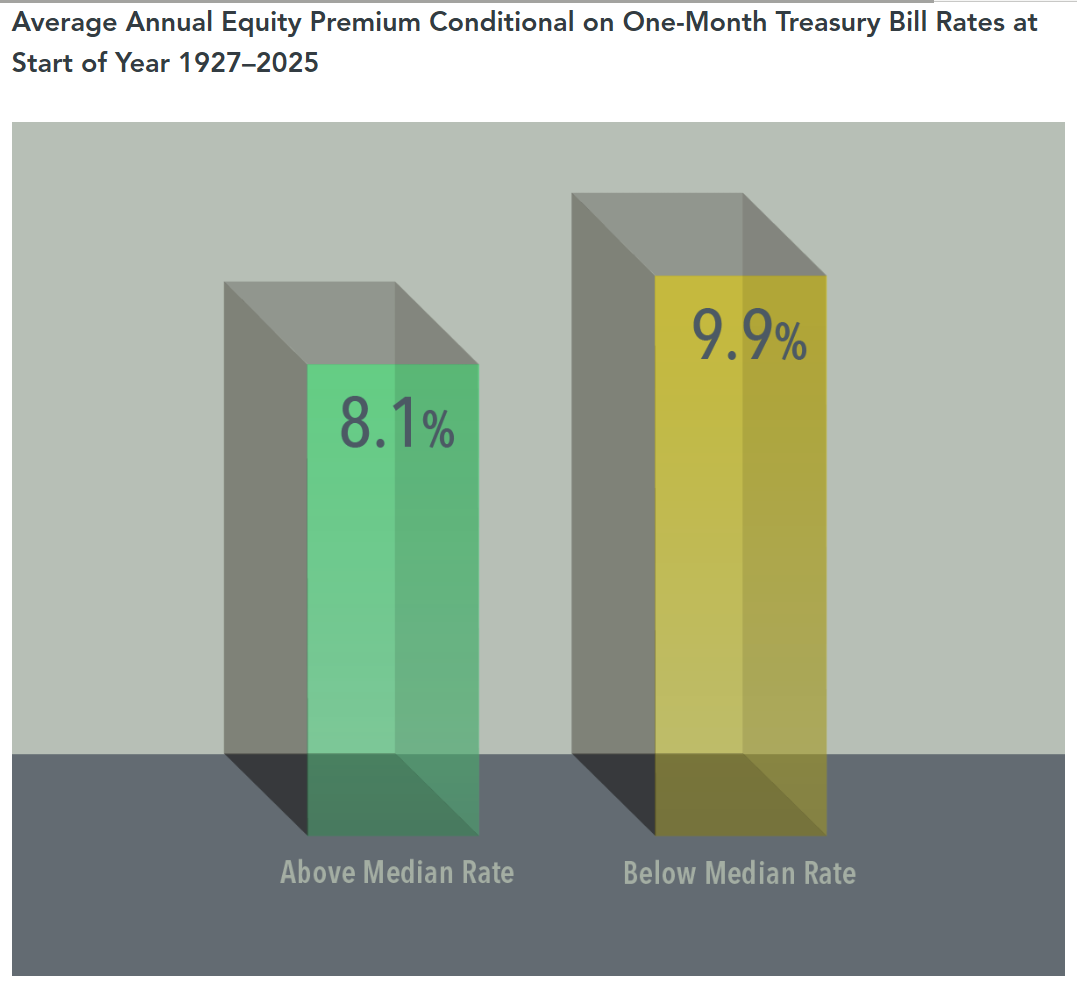
I like the argument, but the DFA article left me wanting a little. more. I don’t think T-bills are the right yardstick. Nobody is really choosing between the S&P 500 and a one-month bill. And, I wanted to know if there were certain thresholds where this breaks down. Perhaps 5% isn’t bad, but what about 7%, or 8%?
So I ran this analysis again against the 10-year, since that is what has been getting all of the attention this week, and broke out returns over more specific interest rate periods.
Sorting 98 years by the 10-year yield
I took every year from 1928 through 2025 and sorted it by where the 10-year Treasury yield stood in January. Then I checked how stocks did against bonds over the rest of that year.

First, let’s look if the dividing line is 5%, because that’s the number people are asking about. It puts 34 years in the “bonds pay 5%+” bucket: an unbroken run from 1968 through 2002, except 1999, which just missed at 4.72%. The other 64 years cover the 1930s through the 1960s and everything since 2003.
Stocks didn’t get worse. Bonds got better.
I expected to find stocks struggling when rates were high. That’s not what happened.

| Years starting with the 10-year… | Stocks (avg per year) | 10-year bonds (avg per year) | Stocks’ edge (Equity premium) |
|---|---|---|---|
| Above 5% (34 years) | 11.2% | 8.9% | 2.3 points |
| At or below 5% (64 years) | 12.2% | 2.6% | 9.6 points |
Stocks earned roughly the same either way. The whole difference came from bonds, which earned more than three times as much when they started with a high yield.
Stocks still beat bonds in 19 of those 34 high-yield years. They just won by a much thinner margin.
What if Interest Rates Go Higher?
If high rates were bad for stocks, the highest rates should have been the worst. They weren’t.

In the 12 years that opened with the 10-year above 8% (1979 to 1986 and 1988 to 1991), stocks averaged 18.3% a year. Four of those years topped 30%: 1980, 1985, 1989 and 1991. Bonds did great too at 12.7% a year, but stocks still came out ahead.
The trouble zone was 5% to 8%. Across those 22 years, stocks averaged just 7.4% and beat bonds by half a point. That range holds seven losing years for stocks, 1969, 1973, 1974, 1977, 2000, 2001 and 2002: stagflation and the dot-com bust, basically.
So there’s no straight line from higher rates to worse stocks.
So what do you do with this?
Don’t dump stocks because bonds pay 5%. That trade would have worked in some years and backfired badly in others. In 1980, stocks returned 31.7% while bonds lost 3.0%; in 1997, it was 33.1% against 9.9%.
Do use the moment to look hard at your bonds. A 5% starting yield is a far better deal than the 1% to 2% on offer in 2020 and 2021.
Ask what your bonds are actually for: covering the next several years of spending, smoothing out the ride, or protecting against inflation. That last one is what the 1970s punished people for skipping.
The question was never really about stocks
“Why own stocks at 5%?” sounds like a question about stocks. Across 98 years, it turns out to be a question about bonds: stocks earned 11% to 12% a year no matter where rates started. What changed was how good the alternative looked.
So Dimensional’s instinct holds up better than my first table suggests. The case for stocks didn’t collapse when rates rose. The competition for stocks just got tougher. When bonds pay 5%, the smart move usually isn’t owning fewer stocks. It’s owning better bonds.
Data and fine print

- Annual returns for the S&P 500 (with dividends), 3-month Treasury bills and 10-year Treasury bonds, 1928 to 2025: Aswath Damodaran, NYU Stern, January 2026 update.
- January 10-year Treasury yields: Multpl, built on Robert Shiller’s data before 1953.
- Current yield and “highest since 2007”: Trading Economics, 5.11% close on September 23, 2026.
- Dimensional’s original piece: Wes Crill, “Are Higher Rates Cause to Add More Fixed Income?“